Server & Network Monitoring – Real-Time Visibility with Nagios, Zabbix & Prometheus
Keep your IT infrastructure under constant watch, detect issues before they escalate, and ensure
optimal performance with KV IT-Solutions’ monitoring expertise powered by Nagios, Zabbix, and
Prometheus.

modern IT environments demand continuous visibility into servers, applications, and network devices.
Downtime, resource bottlenecks, or misconfigurations can affect business operations, productivity, and customer satisfaction.
KV IT-Solutions leverages Nagios, Zabbix, and Prometheus to provide real-time insights, proactive alerts,
and automated monitoring for Linux servers, virtual environments, and network infrastructure.
With our monitoring solutions, your organization can achieve:
Proactive Issue Detection – Detect and resolve server or network issues before they impact operations.
Optimized Performance – Continuous analysis of resource usage, traffic, and workloads to maintain efficiency.
Comprehensive Visibility – Monitor all critical components with Nagios, Zabbix, and Prometheus.
Compliance & Audit-Ready Logs – Maintain detailed, secure records for regulatory standards.
Monitoring Tools USE LOGO BELOW
 Real-time enterprise monitoring with alerts and plugin support.
 Centralized dashboards with automated triggers and notifications.
.png) Cloud-native metrics and alerting for containers and microservices.
Cloud-native metrics and alerting for containers and microservices.
With KV IT-Solutions, gain complete visibility, proactive management, and reliable IT operations—
keeping your infrastructure secure, efficient, and always online.
Monitoring Tools We Leverage: Nagios, Zabbix, and Prometheus
Modern IT infrastructure requires robust monitoring tools to maintain uptime, optimize performance, and
detect issues before they impact business operations. At KV IT-Solutions, we leverage Nagios, Zabbix,
and Prometheus to provide comprehensive monitoring coverage..
1. Nagios – The Veteran Monitoring Platform
What it is: Nagios is a widely used, open-source monitoring system that tracks the health of servers,
networks, and applications. It’s ideal for detecting failures, performance bottlenecks, and unusual activity.
How it works:
Monitors host resources like CPU, memory, disk, and I/O
Checks service availability, including web servers, databases, and mail servers
Sends alerts via email, SMS, or messaging apps when thresholds are breached
Supports plugins and integrations for customized monitoring
Why it matters: Nagios provides real-time alerts and ensures critical infrastructure components are
always operational, minimizing downtime.
.png)
2. Zabbix – End-to-End Enterprise Monitoring
What it is: Zabbix is an enterprise-grade monitoring tool designed for large-scale IT environments.
It provides network, server, and application monitoring with advanced visualization features.
How it works:
Collects metrics from servers, network devices, and applications
Monitors performance indicators like bandwidth, latency, and packet loss
Provides customizable dashboards and reports for operational insights
Supports automated triggers, notifications, and escalations
Why it matters: Zabbix gives a centralized view of your entire IT ecosystem, helping IT teams
identify performance issues before they escalate into critical failures.
.png)
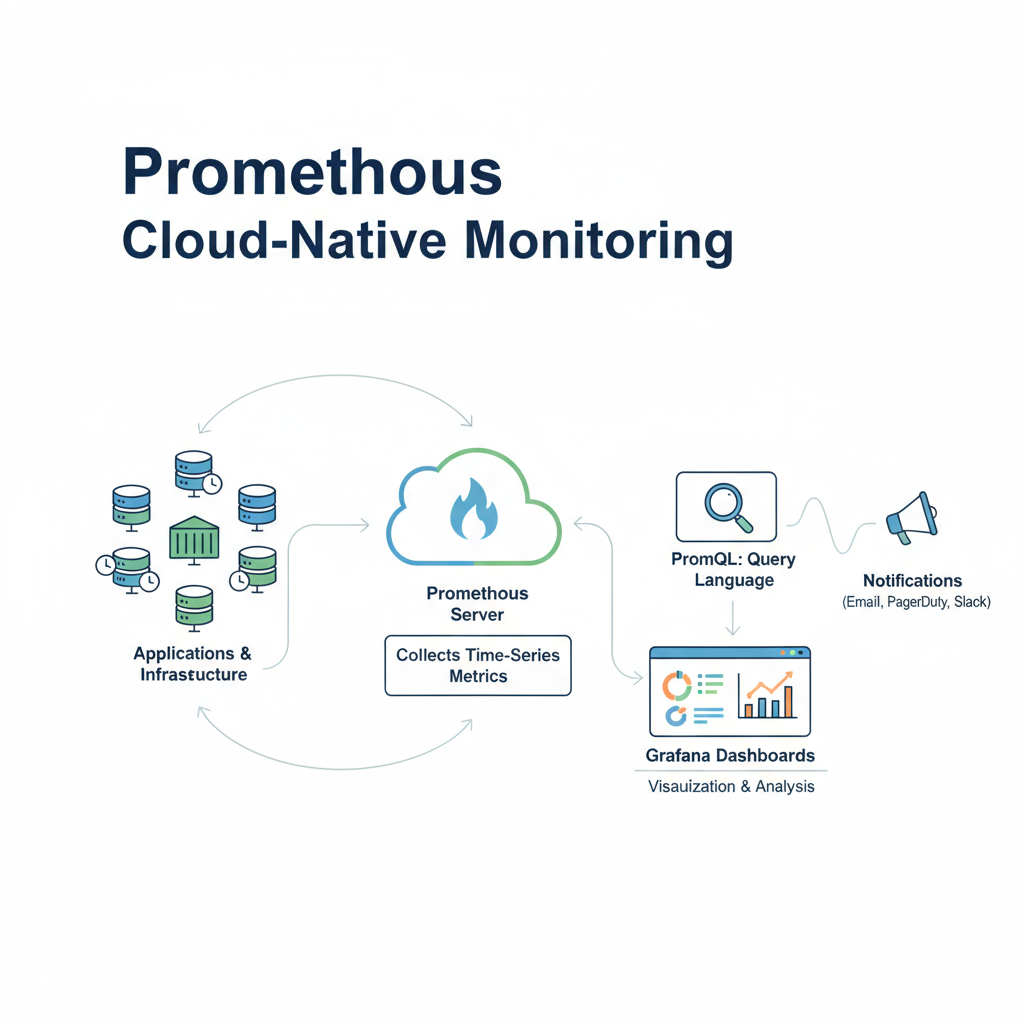
3. Prometheus – Cloud-Native Monitoring for Modern Applications
What it is: Prometheus is a powerful, open-source monitoring and alerting system specifically
designed for cloud-native environments and containerized applications, such as Docker and Kubernetes.
How it works:
Collects time-series metrics from applications and infrastructure
Stores and queries data using its flexible PromQL language
Integrates seamlessly with Grafana for visual dashboards
Supports alerting rules for proactive incident response
Why it matters: Prometheus enables real-time monitoring of dynamic, containerized environments,
ensuring application reliability, performance, and scalability.
Benefits of Using These Tools Together
By combining Nagios, Zabbix, and Prometheus, KV IT-Solutions provides:
-
Comprehensive Coverage – Monitor servers, networks, applications, and cloud-native workloads
-
Proactive Alerts – Detect and resolve issues before they impact operations
-
Centralized Visualization – Single-pane dashboards for IT teams
-
Scalable Monitoring – From small setups to large, hybrid-cloud deployments
Why Server & Network Monitoring is Critical
Without monitoring:
-
Downtime may go unnoticed until operations are affected
-
Performance bottlenecks reduce application speed
-
Security threats remain hidden, increasing breach risk
-
Troubleshooting becomes reactive and inefficient
Proper monitoring with Nagios, Zabbix, and Prometheus ensures operational stability, rapid issue detection, and continuous availability.
Core Server & Network Monitoring Services
KV IT-Solutions provides end-to-end monitoring solutions using Nagios, Zabbix, and Prometheus:
1. Server Monitoring with Nagios
Definition: Track the health, performance, and availability of physical and virtual servers in real-time.
How it works:
Monitor CPU, memory, disk usage, and I/O performance
Detect system errors, crashes, and high-load scenarios
Configure automated alerts for anomalies
Impact: Reduces downtime, ensures reliability, and prevents system failures.
2. Network Monitoring with Zabbix
Definition: Maintain network health, prevent congestion, and optimize traffic flow.
How it works:
Monitor routers, switches, firewalls, and endpoints
Track bandwidth, latency, and packet loss
Receive alerts for unusual network activity
Impact: Ensures seamless connectivity, prevents data loss, and strengthens security.
3. Application & Service Monitoring with Prometheus
Definition: Observe mission-critical applications, containers, and services for performance and uptime.
How it works:
Monitor web servers, databases, and containerized applications
Track response times, error rates, and resource consumption
Generate performance metrics and actionable reports
Impact: Improves user experience, ensures SLA compliance, and reduces downtime.
4. Alerting & Incident Management
Definition: Proactively notify teams of critical issues and streamline incident resolution.
How it works:
Automated alerts via email, SMS, or messaging apps
Escalation policies for urgent events
Integration with ITSM or ticketing systems
Impact: Minimizes downtime and accelerates response.
5. Reporting & Analytics
Definition: Provide insights for capacity planning, trend analysis, and performance optimization.
How it works:
Custom dashboards in Nagios, Zabbix, and Prometheus
Historical trend analysis and predictive insights
Audit-ready logs and compliance reporting
Impact: Supports strategic decision-making, improves efficiency, and ensures operational compliance.
Benefits of Using Nagios, Zabbix, and Prometheus
-
Comprehensive Coverage – Monitor servers, networks, applications, and cloud resources
-
Proactive Alerts & Automation – Detect and resolve issues before they escalate
-
Centralized Monitoring – Unified view of entire IT infrastructure
-
Performance Insights – Optimize workloads and prevent resource conflicts
-
Scalable & Future-Ready – Adaptable to growing IT environments and hybrid-cloud deployments
Challenges Without Proper Monitoring
-
Unnoticed outages causing extended downtime
-
Performance degradation and slow applications
-
Security threats going undetected
-
Lack of compliance and audit readiness
-
Manual tracking leading to inefficiency
KV IT-Solutions Approach
1
Assessment – Evaluate servers, networks, applications, and cloud resources
2
Planning – Design a customized monitoring strategy using Nagios, Zabbix, and Prometheus
3
Implementation – Deploy monitoring tools, configure dashboards, alerts, and automated workflows
4
Validation – Test alerts, dashboards, and reporting workflows
5
Ongoing Support – Continuous updates, tuning, and monitoring optimization
FAQ
FAQs – Server & Network Monitoring
Nagios provides enterprise-grade monitoring with real-time alerts and plugin support,
Zabbix offers centralized dashboards, automated triggers, and proactive notifications,
while Prometheus is cloud-native and ideal for monitoring containers and microservices
with advanced analytics and alerting.
Yes, these tools can be integrated to provide a layered monitoring approach—Nagios for alerts,
Zabbix for centralized dashboards, and Prometheus for cloud-native metrics—giving comprehensive visibility
across all environments.
Proactive monitoring detects performance issues, resource bottlenecks, or misconfigurations early,
allowing IT teams to resolve problems before they affect users or critical operations.
Absolutely. Prometheus is optimized for cloud-native workloads,
while Nagios and Zabbix can monitor both on-premises and cloud or hybrid infrastructure.
Alerts are fully customizable based on thresholds, events, or anomalies.
Notifications can be sent via email, SMS, or integrated with incident management platforms
to ensure rapid response.
Yes. We create tailored dashboards and automated reports in Zabbix, Nagios, or Prometheus
to visualize critical metrics, track performance trends, and support decision-making.
Monitoring generates detailed logs of server, application, and network activity.
These audit-ready logs help meet standards like PCI-DSS, HIPAA, ISO, and GDPR.
Missed alerts are minimized with redundant monitoring and automated escalation workflows.
Even if an alert is missed, historical logs and metrics allow rapid diagnosis and corrective actions.
modern IT environments demand continuous visibility into servers, applications, and network devices. Downtime, resource bottlenecks, or misconfigurations can affect business operations, productivity, and customer satisfaction. KV IT-Solutions leverages Nagios, Zabbix, and Prometheus to provide real-time insights, proactive alerts, and automated monitoring for Linux servers, virtual environments, and network infrastructure.
With our monitoring solutions, your organization can achieve:
Monitoring Tools USE LOGO BELOW
With KV IT-Solutions, gain complete visibility, proactive management, and reliable IT operations— keeping your infrastructure secure, efficient, and always online.
Monitoring Tools We Leverage: Nagios, Zabbix, and Prometheus
Modern IT infrastructure requires robust monitoring tools to maintain uptime, optimize performance, and detect issues before they impact business operations. At KV IT-Solutions, we leverage Nagios, Zabbix, and Prometheus to provide comprehensive monitoring coverage..
1. Nagios – The Veteran Monitoring Platform
What it is: Nagios is a widely used, open-source monitoring system that tracks the health of servers, networks, and applications. It’s ideal for detecting failures, performance bottlenecks, and unusual activity.
How it works:
Why it matters: Nagios provides real-time alerts and ensures critical infrastructure components are always operational, minimizing downtime.
2. Zabbix – End-to-End Enterprise Monitoring
What it is: Zabbix is an enterprise-grade monitoring tool designed for large-scale IT environments. It provides network, server, and application monitoring with advanced visualization features.
How it works:
Why it matters: Zabbix gives a centralized view of your entire IT ecosystem, helping IT teams identify performance issues before they escalate into critical failures.
3. Prometheus – Cloud-Native Monitoring for Modern Applications
What it is: Prometheus is a powerful, open-source monitoring and alerting system specifically designed for cloud-native environments and containerized applications, such as Docker and Kubernetes.
How it works:
Why it matters: Prometheus enables real-time monitoring of dynamic, containerized environments, ensuring application reliability, performance, and scalability.
Benefits of Using These Tools Together
By combining Nagios, Zabbix, and Prometheus, KV IT-Solutions provides:
- Comprehensive Coverage – Monitor servers, networks, applications, and cloud-native workloads
- Proactive Alerts – Detect and resolve issues before they impact operations
- Centralized Visualization – Single-pane dashboards for IT teams
- Scalable Monitoring – From small setups to large, hybrid-cloud deployments
Why Server & Network Monitoring is Critical
Without monitoring:
- Downtime may go unnoticed until operations are affected
- Performance bottlenecks reduce application speed
- Security threats remain hidden, increasing breach risk
- Troubleshooting becomes reactive and inefficient
Proper monitoring with Nagios, Zabbix, and Prometheus ensures operational stability, rapid issue detection, and continuous availability.
Core Server & Network Monitoring Services
KV IT-Solutions provides end-to-end monitoring solutions using Nagios, Zabbix, and Prometheus:
1. Server Monitoring with Nagios
Definition: Track the health, performance, and availability of physical and virtual servers in real-time.
How it works:
Impact: Reduces downtime, ensures reliability, and prevents system failures.
2. Network Monitoring with Zabbix
Definition: Maintain network health, prevent congestion, and optimize traffic flow.
How it works:
Impact: Ensures seamless connectivity, prevents data loss, and strengthens security.
3. Application & Service Monitoring with Prometheus
Definition: Observe mission-critical applications, containers, and services for performance and uptime.
How it works:
Impact: Improves user experience, ensures SLA compliance, and reduces downtime.
4. Alerting & Incident Management
Definition: Proactively notify teams of critical issues and streamline incident resolution.
How it works:
Impact: Minimizes downtime and accelerates response.
5. Reporting & Analytics
Definition: Provide insights for capacity planning, trend analysis, and performance optimization.
How it works:
Impact: Supports strategic decision-making, improves efficiency, and ensures operational compliance.
Benefits of Using Nagios, Zabbix, and Prometheus
- Comprehensive Coverage – Monitor servers, networks, applications, and cloud resources
- Proactive Alerts & Automation – Detect and resolve issues before they escalate
- Centralized Monitoring – Unified view of entire IT infrastructure
- Performance Insights – Optimize workloads and prevent resource conflicts
- Scalable & Future-Ready – Adaptable to growing IT environments and hybrid-cloud deployments
Challenges Without Proper Monitoring
- Unnoticed outages causing extended downtime
- Performance degradation and slow applications
- Security threats going undetected
- Lack of compliance and audit readiness
- Manual tracking leading to inefficiency
KV IT-Solutions Approach
Assessment – Evaluate servers, networks, applications, and cloud resources
Planning – Design a customized monitoring strategy using Nagios, Zabbix, and Prometheus
Implementation – Deploy monitoring tools, configure dashboards, alerts, and automated workflows
Validation – Test alerts, dashboards, and reporting workflows
Ongoing Support – Continuous updates, tuning, and monitoring optimization
FAQs – Server & Network Monitoring
Core Linux Virtualization, Cloud & Continuity Capabilities

"Monitor. Detect. Resolve. — Keep Your IT Infrastructure Always Online with KV IT-Solutions."
Keep your IT infrastructure resilient and efficient with KV IT-Solutions’ monitoring expertise. Using Nagios, Zabbix, and Prometheus, we provide real-time insights, proactive alerts, and analytics to minimize downtime, optimize performance, and ensure compliance.
Testimonials
 Enquiry Now